Marimo
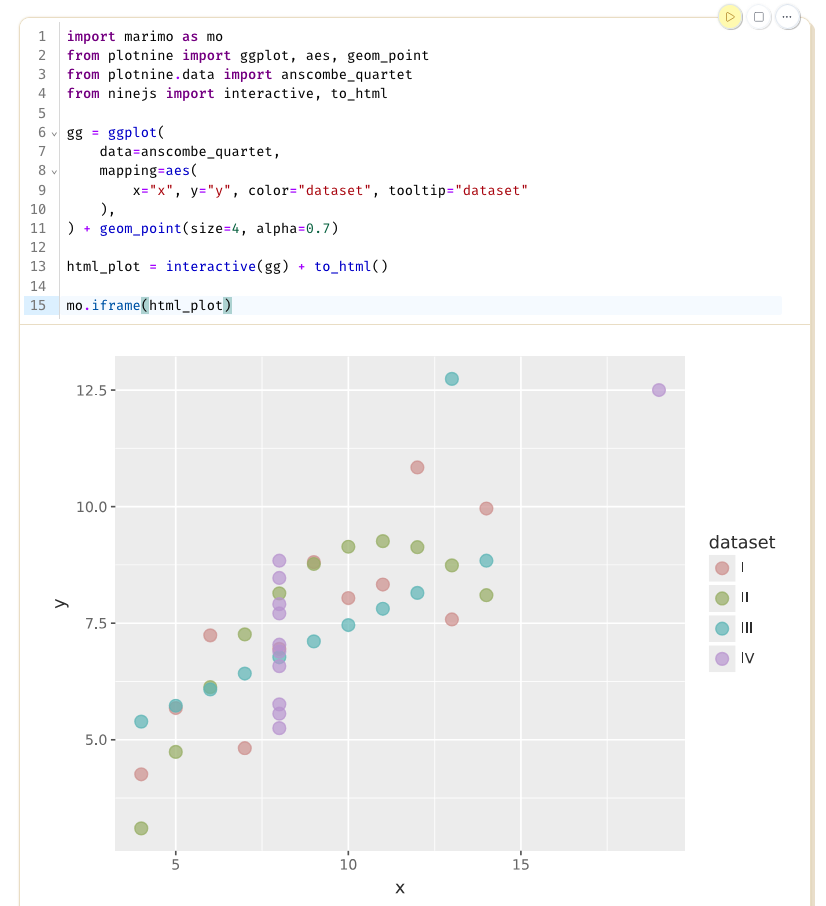
In marimo, use the built-in mo.iframe() function. This function expects an HTML string, which you can create with the to_html() function from ninejs.
import marimo as mo
from plotnine import ggplot, aes, geom_point
from plotnine.data import anscombe_quartet
from ninejs import interactive, to_html

gg = (
   ggplot(
      data=anscombe_quartet,
      mapping=aes(x="x", y="y", color="dataset", tooltip="dataset"),
   )
   + geom_point(size=4, alpha=0.7)
)

html_plot = interactive(gg) + to_html()

mo.iframe(html_plot)