Positron
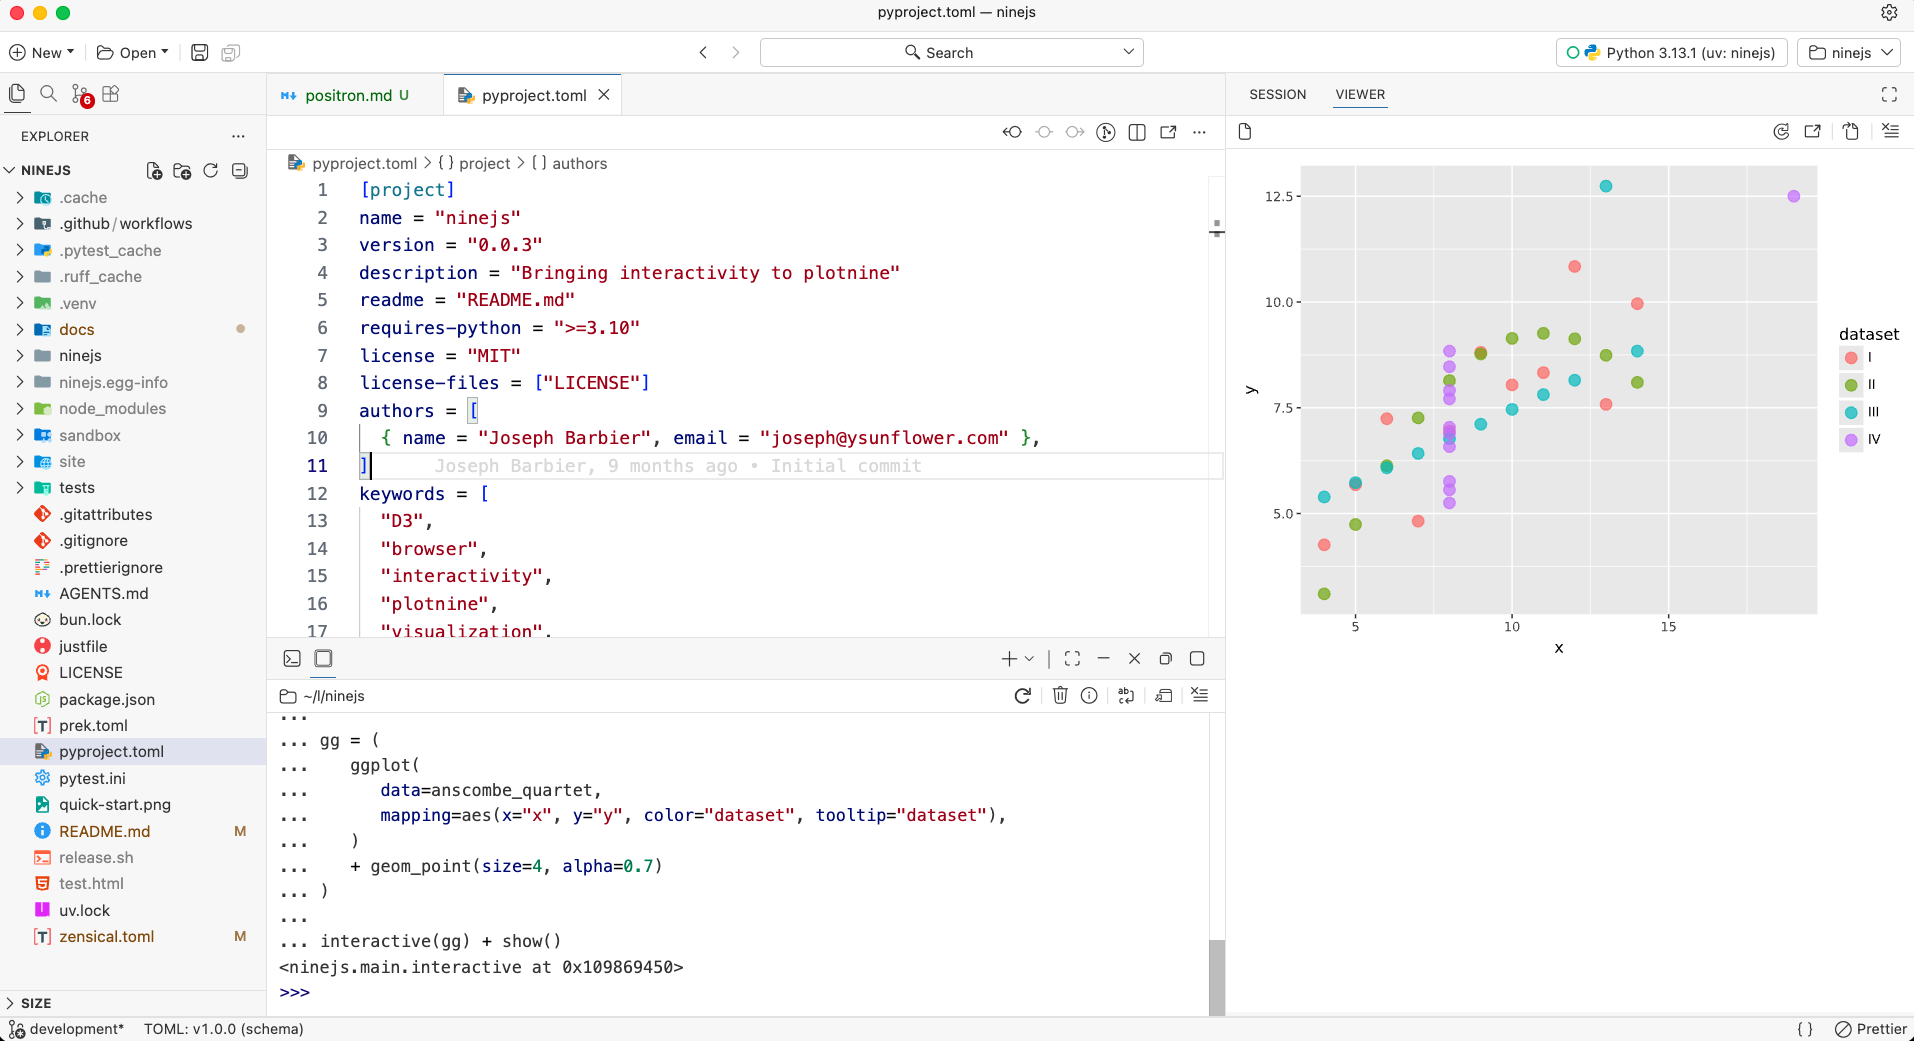
Positron automatically detects the HTML-based plot and opens the built-in plot panel, where you can interact with the chart:
from plotnine import ggplot, aes, geom_point
from plotnine.data import anscombe_quartet
from ninejs import interactive, show

gg = (
   ggplot(
      data=anscombe_quartet,
      mapping=aes(x="x", y="y", color="dataset", tooltip="dataset"),
   )
   + geom_point(size=4, alpha=0.7)
)

interactive(gg)