Example usage
pypalettes offers 3 functions:
load_palette(): the core function that loads a palette from one of the 2500+ available palettes. All available palettes can be found in the Color Palette Finder.load_cmap(): the core function that loads a colormap (matplotlib color object) from one of the 2500+ available palettes. All available palettes can be found in the Color Palette Finder.create_cmap(): a function to create your own colormaps from a list of colors.show_cmap(): a function to preview the colors of a given palette.
Since those functions are built for matplotlib, they work with any matplotlib-based plotting library (seaborn, plotnine, (geo)pandas, cartopy, statsmodels, etc). For Altair and Plotly, pass the list of colors from load_palette() into each library's color scale API (see examples below).
Also, you have to understand the difference between a palette and a colormap (or cmap).
- palette: a list of colors, such as ["#D57A6D", "#E8B762", "#9CCDDF", "#525052"]. It's not necessarly related to data visualization, but design in general.
- colormap: in the context of
matplotlib, this a special object that contains colors and can be used to map colors and values.
Let's see how to use them in concrete examples!
load_cmap()
- In matplotlib
# mkdocs: render
import matplotlib.pyplot as plt
from pypalettes import load_cmap

cmap = load_cmap("Acadia")

x = [1, 2, 3, 4, 5, 6, 7, 8, 9]
y = [2, 1, 4, 3, 5, 7, 6, 9, 8]
c = [1, 3, 1, 2, 3, 2, 1, 3, 2]

fig, ax = plt.subplots()
ax.scatter(x, y, c=c, s=500, cmap=cmap)

load_palette()
- In seaborn
# mkdocs: render
import seaborn as sns
from pypalettes import load_palette

palette = load_palette("Fun")  # list of colors

df = sns.load_dataset("penguins")

g = sns.lmplot(
    data=df,
    x="bill_length_mm",
    y="bill_depth_mm",
    hue="species",
    palette=palette,
)

- In plotnine
# mkdocs: render
import pandas as pd
from plotnine import ggplot, aes, geom_bar, theme_minimal, scale_fill_gradientn
from pypalettes import load_palette

df = pd.DataFrame({"category": ["A", "B", "C", "D", "E"], "value": [10, 15, 7, 12, 20]})

colors = load_palette("Arches2", reverse=True)

(
    ggplot(df, aes(x="category", y="value", fill="value"))
    + geom_bar(stat="identity")
    + scale_fill_gradientn(colors=colors)
    + theme_minimal()
)

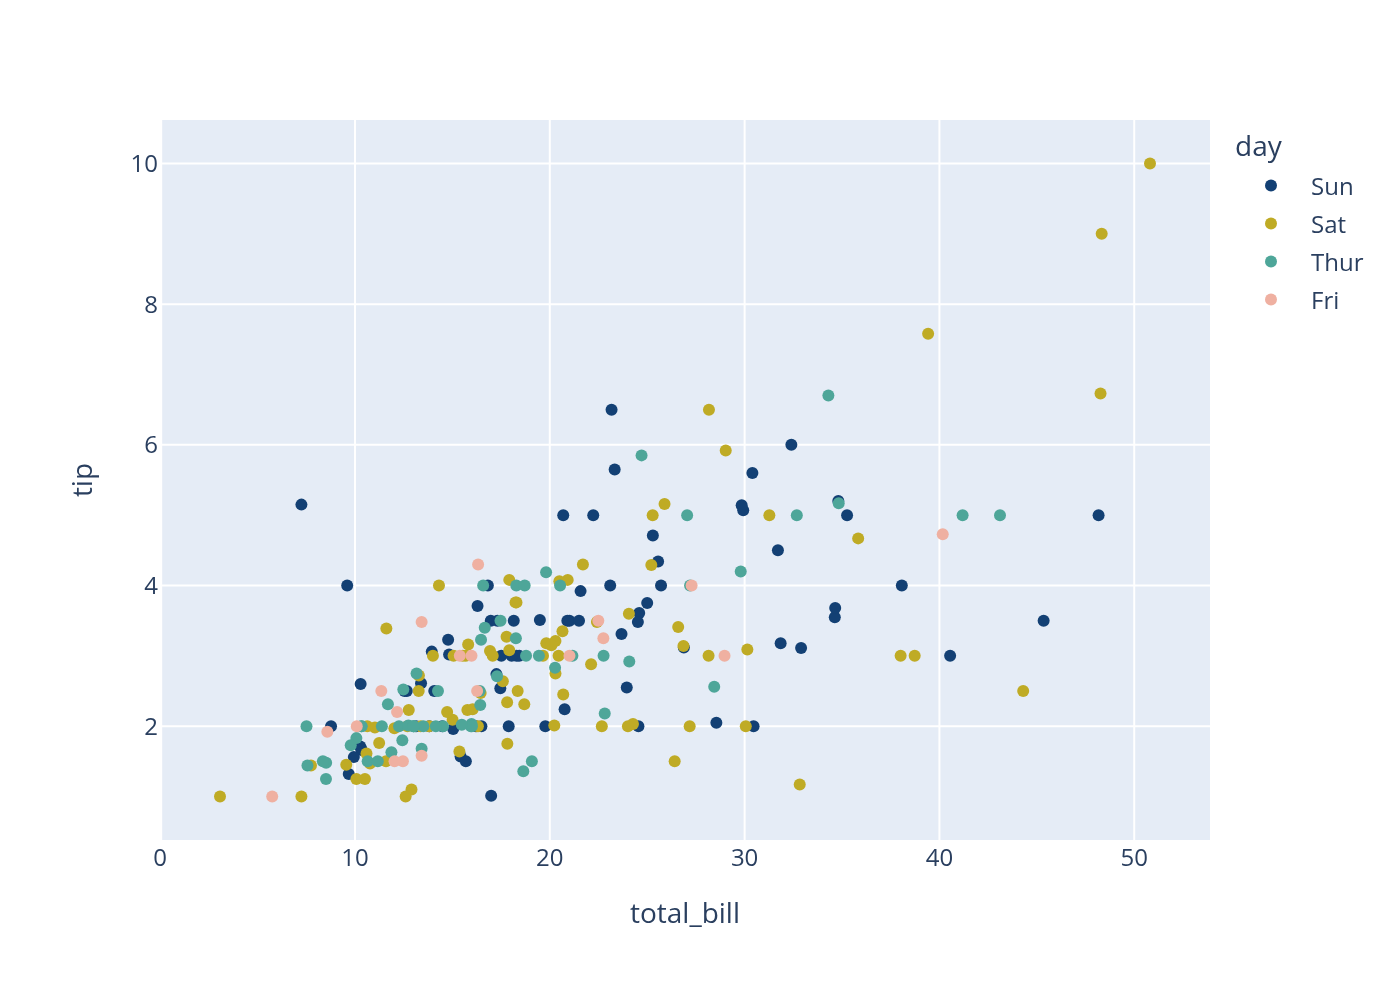
- In Plotly
import plotly.express as px
from pypalettes import load_palette

palette = load_palette("Fun")

df = px.data.tips()

fig = px.scatter(
    df,
    x="total_bill",
    y="tip",
    color="day",
    color_discrete_sequence=palette,
)
fig.show()
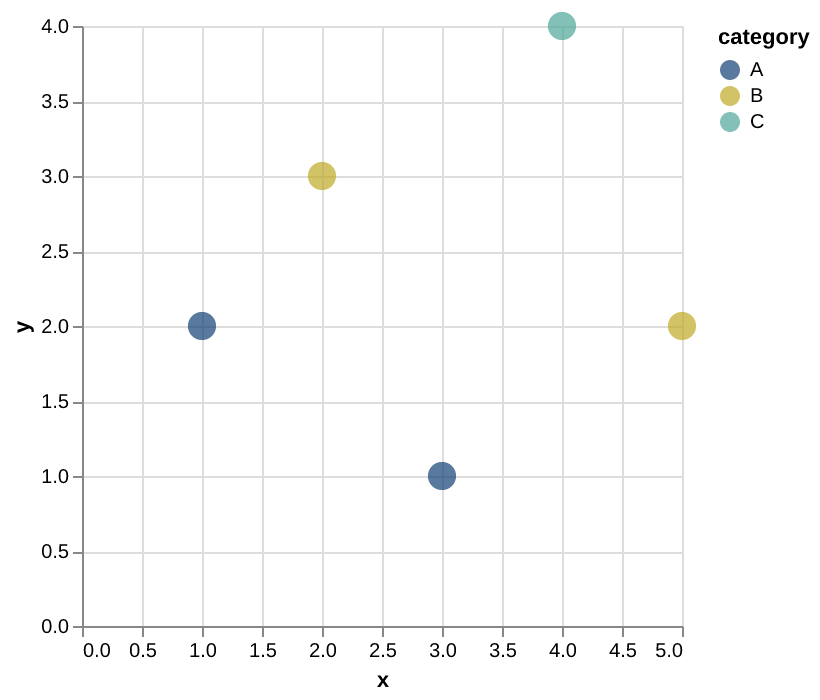
- In Altair
import altair as alt
import pandas as pd
from pypalettes import load_palette

palette = load_palette("Fun")

df = pd.DataFrame(
    {
        "x": [1, 2, 3, 4, 5],
        "y": [2, 3, 1, 4, 2],
        "category": ["A", "B", "A", "C", "B"],
    }
)

(
    alt.Chart(df)
    .mark_circle(size=200)
    .encode(
        x="x:Q",
        y="y:Q",
        color=alt.Color("category:N", scale=alt.Scale(range=palette)),
    )
)
create_cmap()
This function just requires a list of colors, and then you can use its output the same way as load_cmap():
- Create a categorical colormap
# mkdocs: render
import matplotlib.pyplot as plt
from pypalettes import create_cmap
import numpy as np

cmap = create_cmap(["#D57A6D", "#E8B762", "#9CCDDF", "#525052"])

x = np.linspace(0, 20, 1000)
y = np.sin(x)

plt.scatter(x, y, c=y, cmap=cmap)
plt.colorbar()

- Create a continuous colormap
# mkdocs: render
import matplotlib.pyplot as plt
from pypalettes import create_cmap
import numpy as np

cmap = create_cmap(
    ["#D57A6D", "#E8B762", "#9CCDDF", "#525052"],
    cmap_type="continuous",
)

x = np.linspace(0, 20, 1000)
y = np.sin(x)

plt.scatter(x, y, c=y, cmap=cmap)
plt.colorbar()

show_cmap()
Finally, the utility function to preview the colors from a colormap.


